Finally understand what makes money grow.
Learn the variables that drive investing: contributions, time, mix, inflation, taxes. Change one, run the scenario, and watch the outcome move, with the risk shown right beside the upside and every number explained in plain English. Hypothetical numbers only, so you can't do it wrong.
Ask “what if” before life does.
See how it worksNo account · nothing leaves your device.
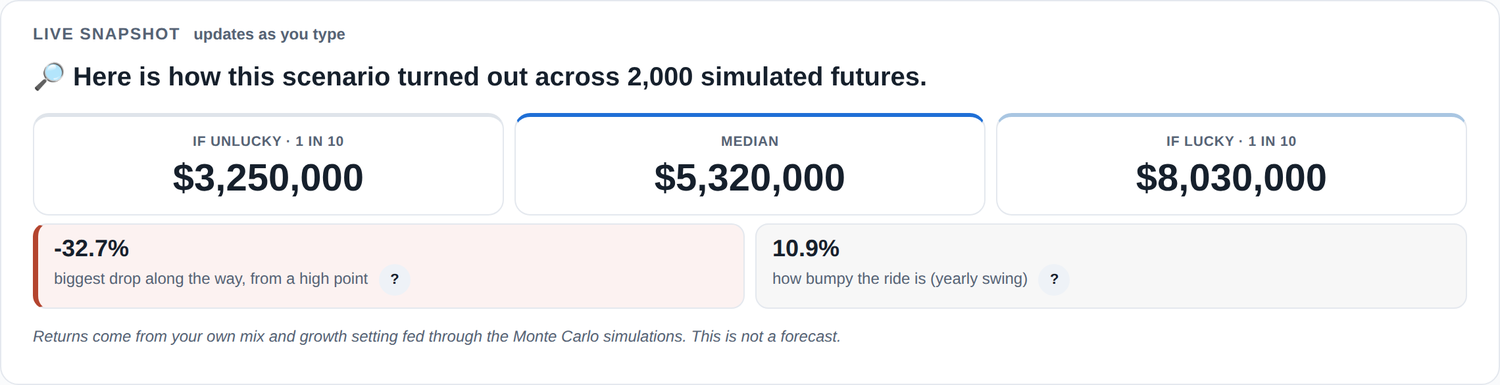

Reading the snapshot above: this example puts in $250,000 to start plus $50,000 a year for 30 years, in a growth-leaning mix. Across 2,000 simulated futures the middle result lands near $5.32M, with the unlucky 1-in-10 near $3.25M and the lucky 1-in-10 near $8.03M. Right below, the same run shows the risk you would have lived through to get there: a worst drop of about 33% along the way, and a typical yearly swing near 11%. The upside and the risk, side by side. That is the whole idea, not one rosy number.
See what actually drives the outcome
Most calculators give one optimistic projection. This shows the fuller, truer picture, the handful of levers that really move the numbers, and the risk that rides along with the reward, so you understand your options before you act.
Three kinds of tools. This is the fourth.
One-number calculators
Free retirement calculators hand you a single smooth line at an average return. Real markets do not compound smoothly. Scenario Lab shows the range: median, unlucky tenth, lucky ninetieth, with the risk beside it.
Pro-grade analytics
Powerful tools exist for quants and advisors, with jargon to match. Scenario Lab explains every number in plain English and shows the formula and the engine behind it.
Apps that want your accounts
The new wave of finance apps asks you to connect your real accounts to someone's servers. Scenario Lab runs on made-up numbers in your own browser. There is nothing to connect and nothing to leak.
Transparent math, plain language, and privacy by design. You can even run the validation suite yourself on the Self-check tab.
Agency over your financial future, at any stage
The hard truth of investing is this: there are countless variables, no one can predict the market, and there's a wide range of reasonable ways to invest. The real edge isn't a hot tip, it's understanding the dynamics yourself.
Investment Scenario Lab was built to make that easy, a low-stakes place to play with the variables and watch how they interact. Whether you're early in your investing journey or getting closer to retirement, you can test different scenarios, see the full range of outcomes with the risk beside the reward, and build a clear sense of direction before you act.
It's a learning tool, plainly: it won't predict the market, it isn't a financial advisor, and it won't tell you what to buy. It gives you the framework to understand your options, so your next step, whatever it is, is a more educated one.
See the whole picture, upside and risk together
Change one thing at a time, your mix, your horizon, a crash, inflation, taxes, and watch the full range of outcomes respond, with every figure explained in plain language.
Honest Monte Carlo
2,000 randomized futures with real crash years and mean reversion. The range, not a rosy single number.
Risk shown, not buried
Every result pairs the upside with the worst drop along the way and the typical yearly swing, so more growth reads as more risk too, not just a bigger number.
Per-asset-class breakdown
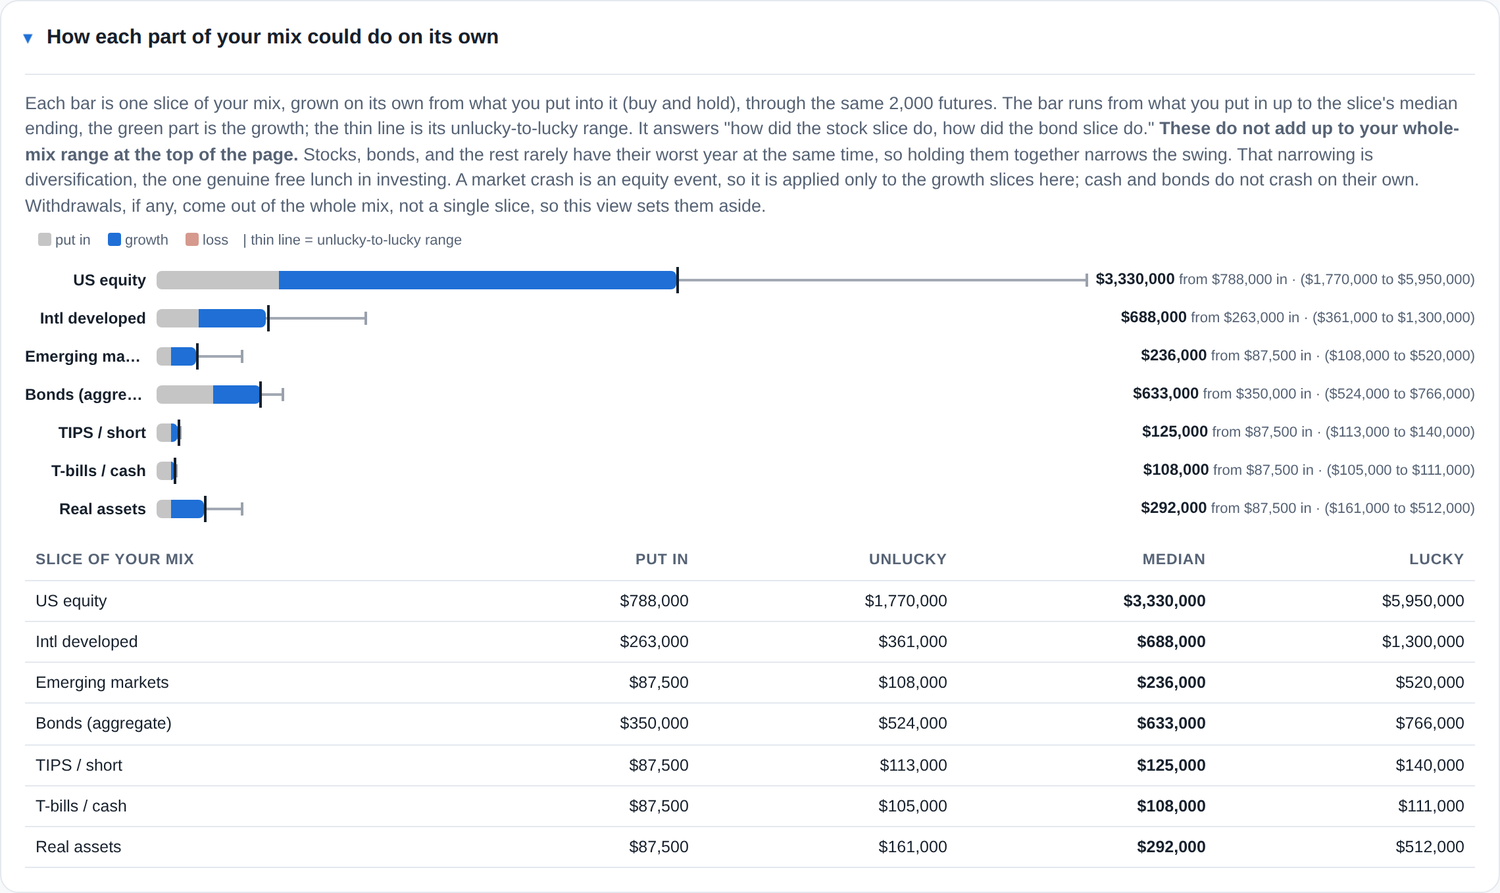
See how each slice, stocks, bonds, cash, real assets, could do on its own, and why the whole mix is steadier than its parts.
Compare mixes on one scale
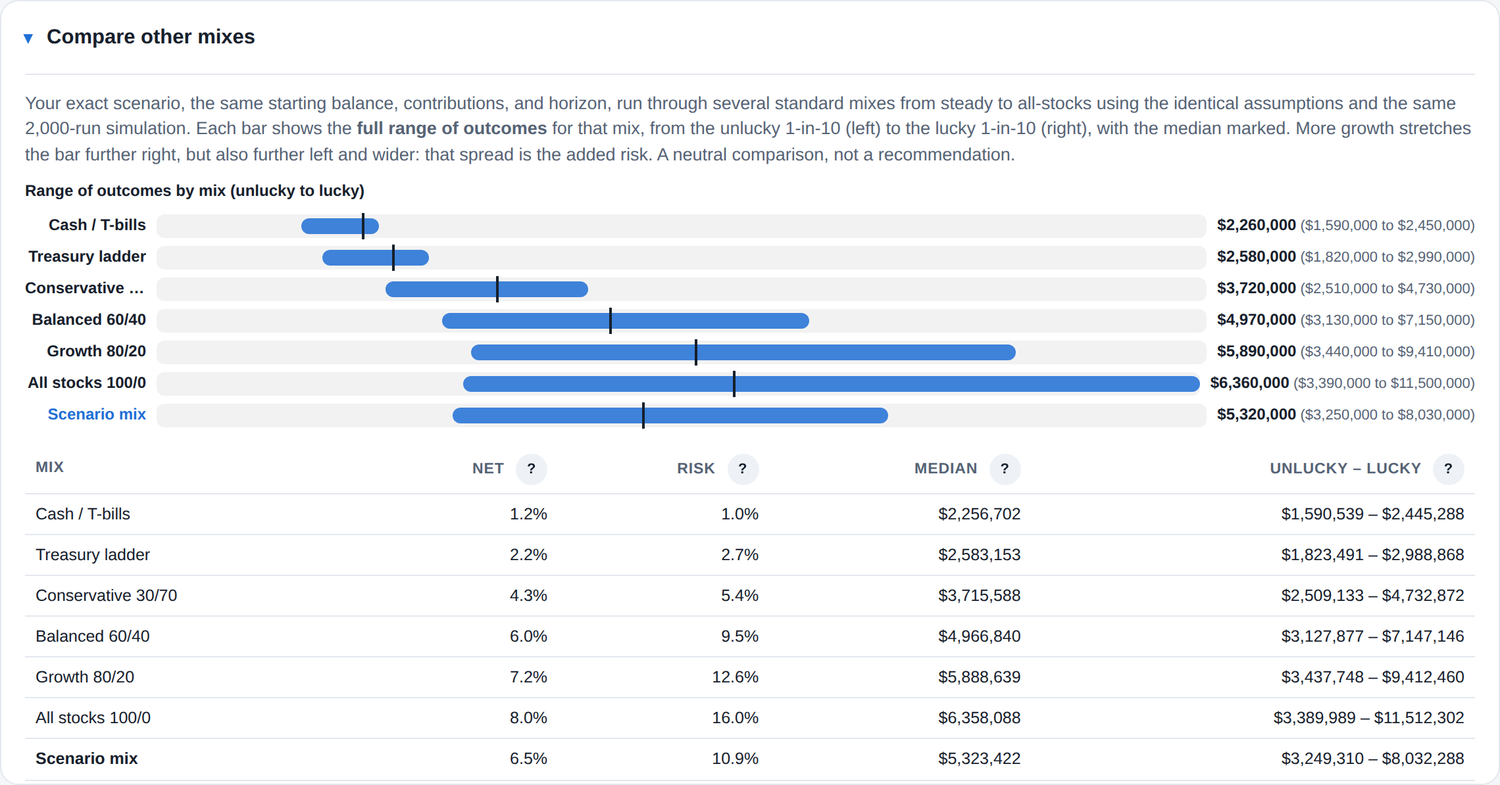
Steady to all-stocks, each drawn as its full unlucky-to-lucky range, so a riskier mix looks wider, not just taller.
Nothing hidden
Every number traces to a named formula, an animated engine shows what goes in, and a live self-check runs 76 tests in your browser.
Tax-aware
See how the same mix lands under Roth, Traditional, and Taxable treatment, blended if you hold across all three.
Compare mixes on one honest scale
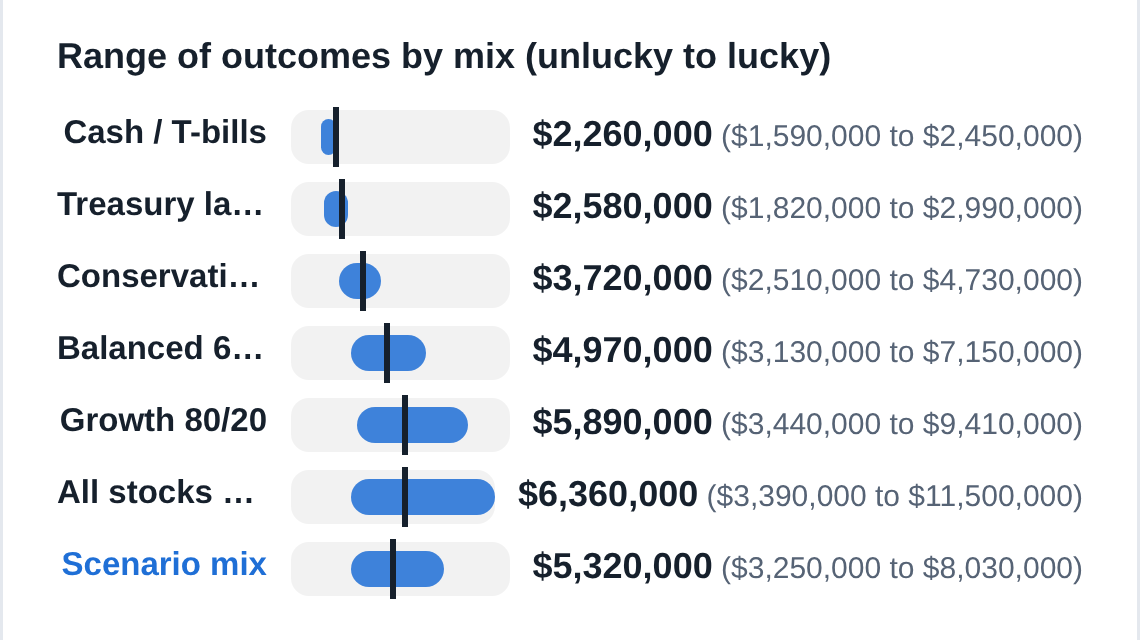
Steady to all-stocks, each mix drawn as its full range from the unlucky tenth to the lucky ninetieth, with the median marked. A higher-growth mix stretches further right, and further left. That extra width is the risk you are taking, shown plainly, so an aggressive mix never looks like a free win.
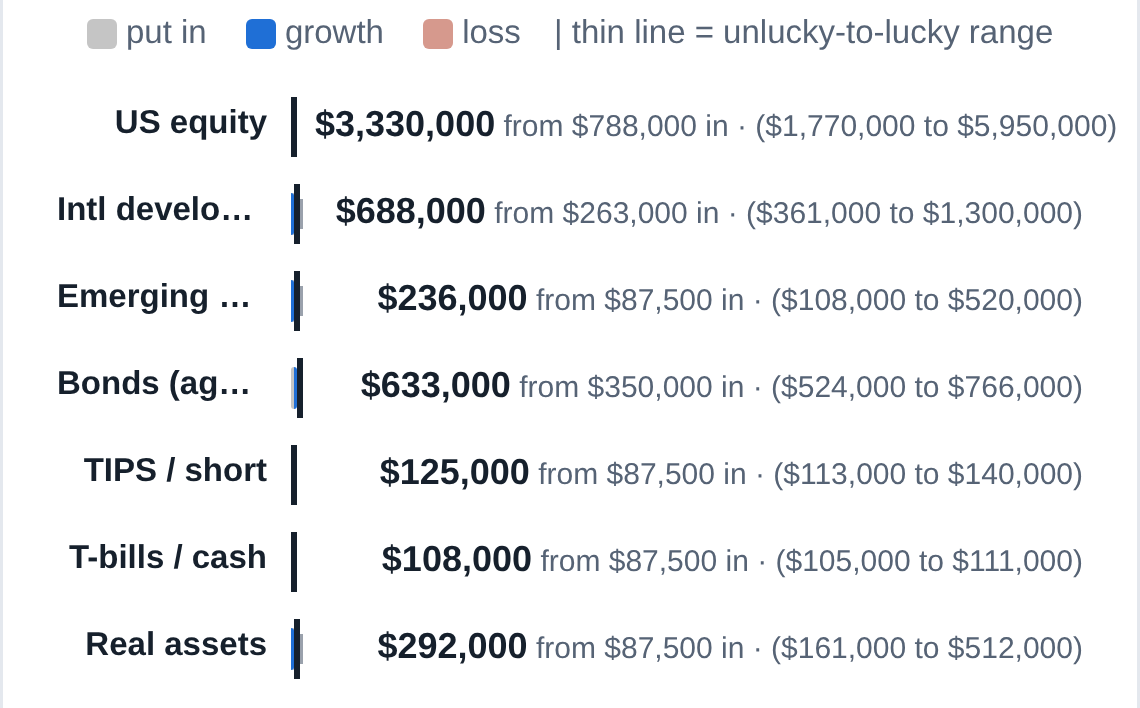
See what each part of your mix does
Every slice, stocks, bonds, cash, real assets, is simulated on its own from what you put into it. It answers “how did the stock slice do, how did the bond slice do,” and shows why holding them together narrows the swing. That narrowing is diversification, the one genuine free lunch in investing.
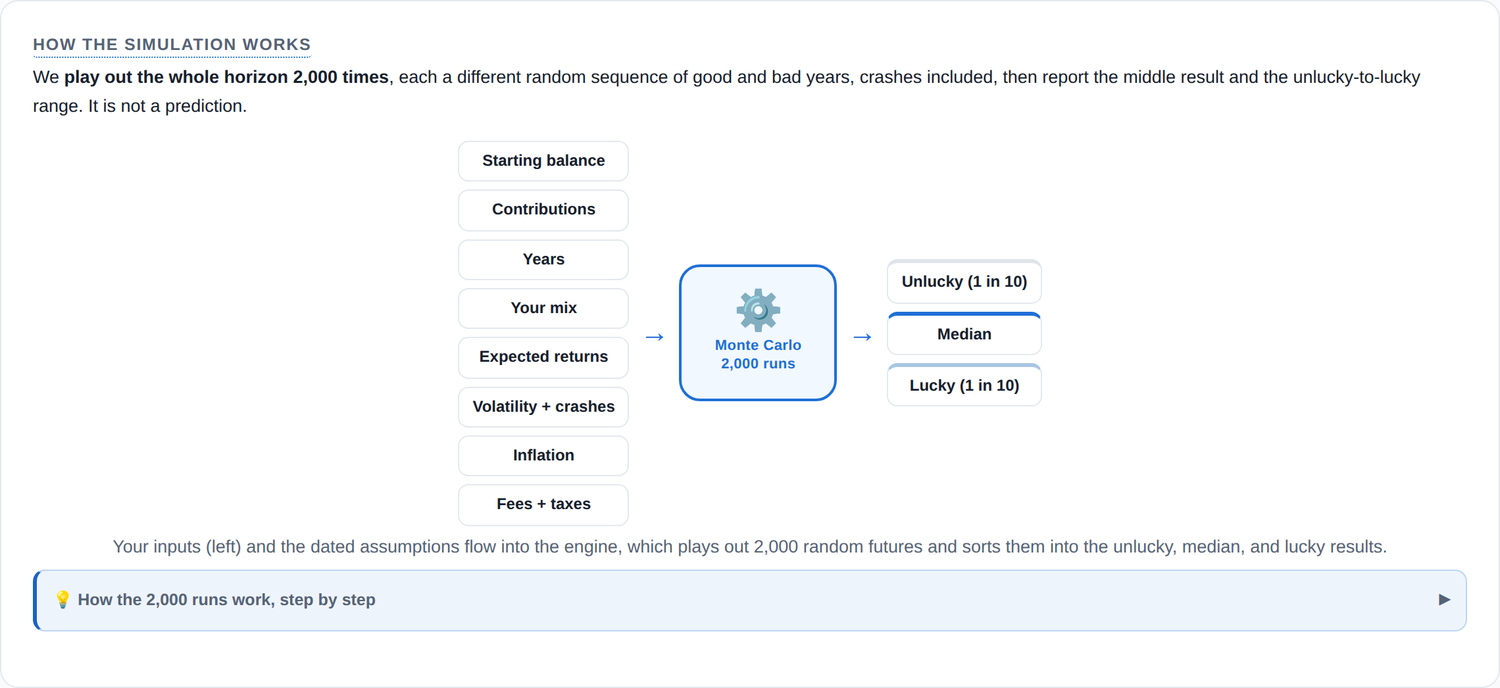
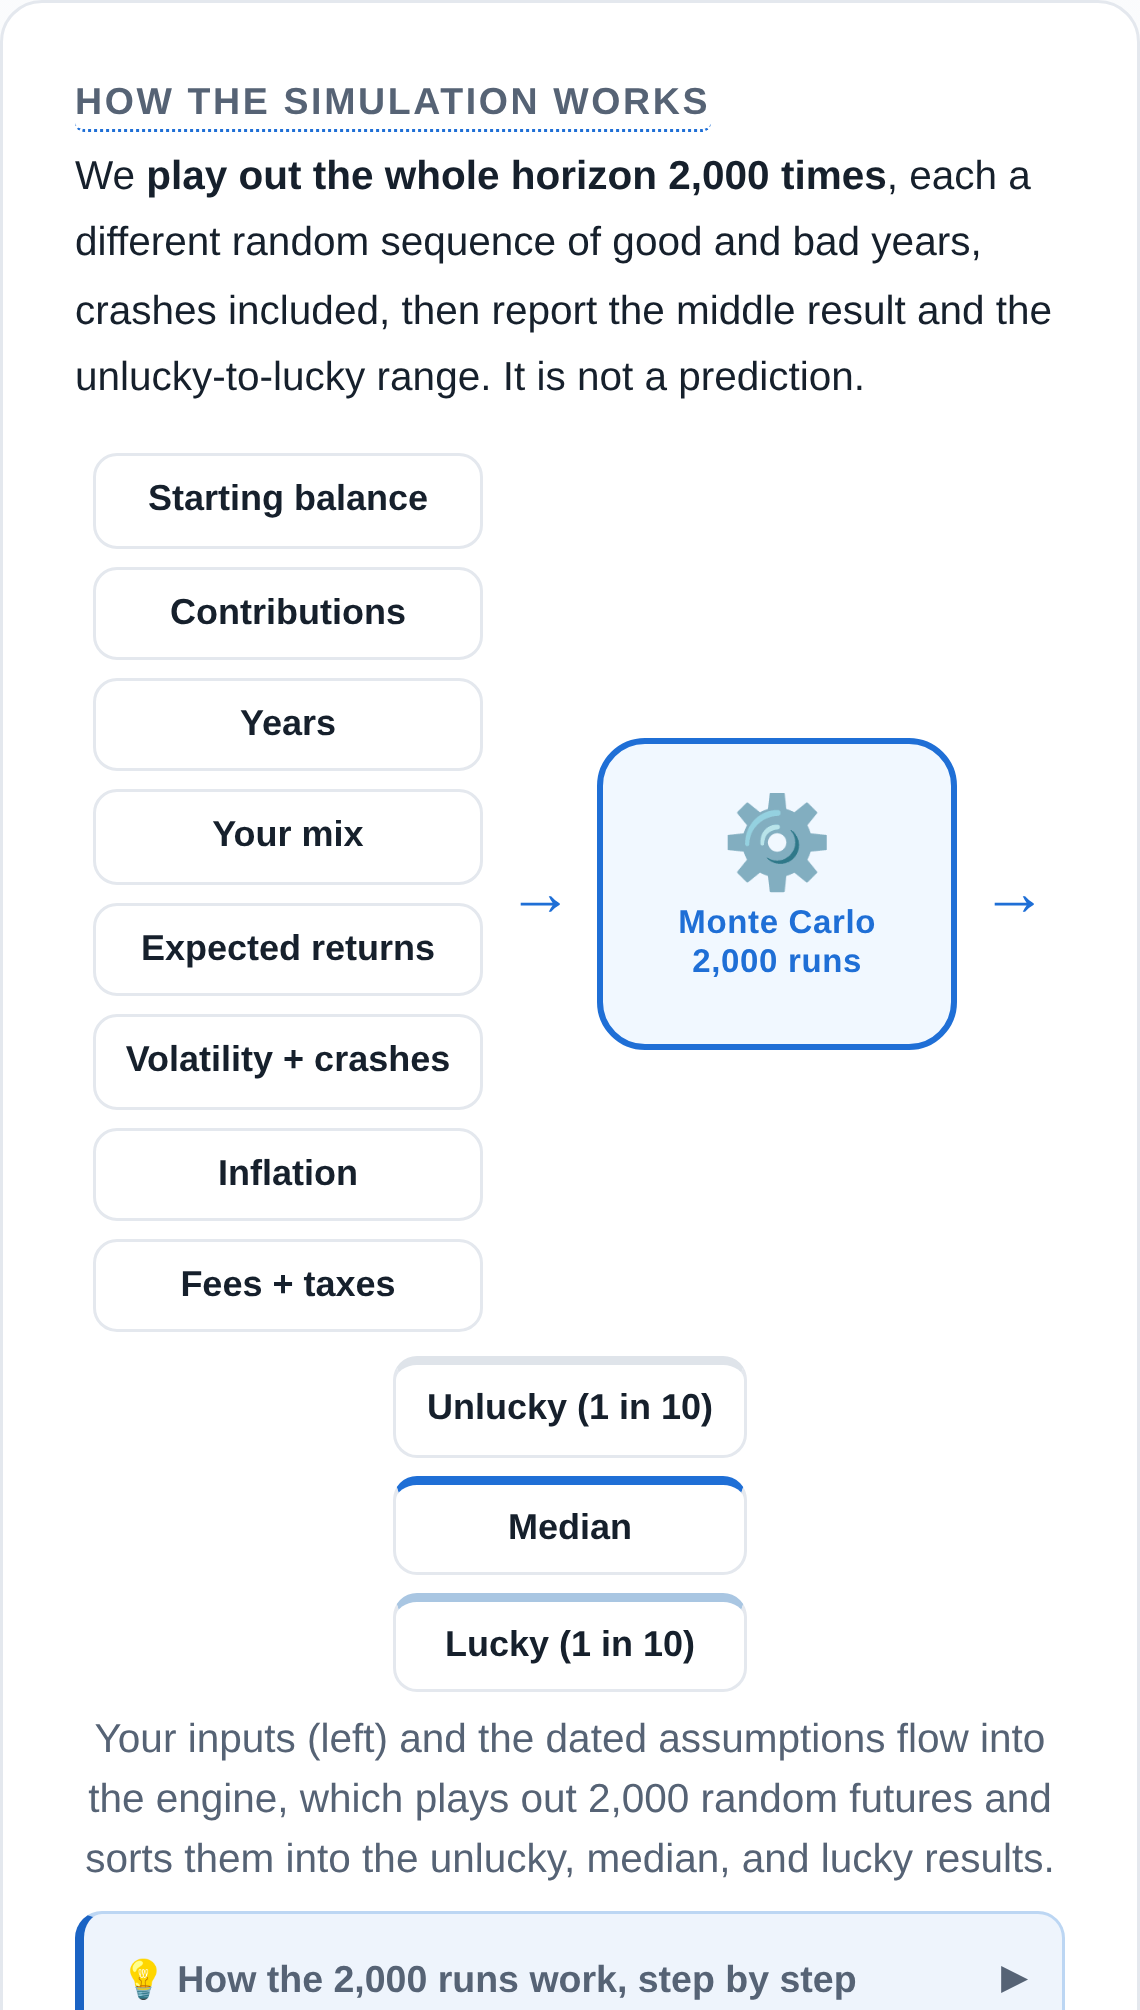
See exactly what the simulation runs on
An animated diagram shows your inputs, starting balance, contributions, years, mix, returns, volatility and crashes, inflation, fees and taxes, flowing into the Monte Carlo engine and coming out as the unlucky, median, and lucky results. The full method and every formula are one click away.
Better than a spreadsheet, and it comes with one
A spreadsheet with one average return draws a single smooth line, and real markets never move in a smooth line. Here is what changes when you run the full simulation instead, and how you can still have the formulas if you want them.
| What you see | A plain spreadsheet | Scenario Lab |
| The outcome | One smooth line at an average return | 2,000 simulated futures, the full unlucky-to-lucky range |
| Crashes & bad decades | Ignored unless you build them by hand | Real crash years and mild mean reversion, built in |
| Risk | A naive average, if any | Correlation-aware risk √(wᵀΣw), plus the worst drawdown |
| The math | You write and debug every formula | Built in and explained, with a 76-test self-check |
| Changing an input | Re-drag formulas, hope nothing broke | Slide it and the whole page updates live |
For wherever you are
Maybe someone else has always handled the money. Maybe you nodded along in the last meeting with the advisor and hated the feeling. This is a place to practice where you cannot do it wrong: hypothetical numbers, no account, no one selling you anything, until you can sit at the table as an equal.
New to investing
Learn the macro dynamics and see how your mix, inflation, and a crash could shape how money grows, or shrinks, over decades.
Seasoned investor
Stress-test your assumptions, compare mixes side by side on one scale, and pressure-check against bad decades.
Stepping into the decisions
Get a grip on the family's financial picture on your own terms, then walk into any money conversation knowing your stuff and asking the right questions.
Simple to use. Honest under the hood.
Describe a scenario
A starting amount, yearly contributions, horizon, and inflation. Round, hypothetical numbers are perfect. No personal details.
Explore the mix
Pick an approach from steady to all-stocks, then fine-tune the sliders and watch the range and the risk update live.
See the range
The median, the unlucky-to-lucky band, the worst drop along the way, and how each slice of the mix does on its own.
Learn the levers
Finish knowing which choices move the outcome and the right questions to ask a professional.
Start free. Upgrade when you need more.
It's genuinely fun to play with, and the core is free to use. Pro unlocks unlimited scenarios, the comparisons, and the Excel model when you want them.
Free
- Full Scenario Lab, Monte Carlo & charts
- Risk shown beside every result
- 1 saved scenario (kept in your browser)
- Runs in your browser, private, no account
Pro
- Everything in Free
- Unlimited saved scenarios & compare
- Unlimited sharing
- Download the Excel model (live formulas)
- Print report (PDF)
- Export outcomes (CSV)
- Import a scenario
- Backup & restore, so a browser cleanup can never erase your work
- Use on up to 5 devices with one license
- Every update for your license year
One-time $14.99 for a full year of Pro, it does not auto-renew. One license works on up to 5 devices. No refunds. When the year ends it simply stops, buy another year to keep Pro. Support is provided through our help docs.
Works anywhere, nothing to install
Any modern browser
Chrome, Safari, Firefox, Edge, on Mac, Windows, Linux, or mobile.
No install, no account
It's a web page. Open a link and you're in, nothing downloaded, nothing to sign up for.
Nothing saved by us
The numbers you type stay in your browser on your device, we don't receive or store them.
How it handles your data
You cannot do it wrong here: the tool is built for made-up numbers, so there is nothing to expose and nothing to get right. It is an open web page on your device, not a login-protected account. Here is simply how it works.
No account for the free tool
Just open it and explore. You only provide an email if you choose to get updates or buy Pro.
We don't save your scenarios
The numbers you type stay in your own browser on your device, we never receive or store them. Clear your browser to erase them.
You can read the code
It runs in your browser, so you can open View Source (or developer tools) and see exactly what it does.
Always on the latest version
It runs in your browser, so everyone is automatically on the newest release, nothing to download or update. (Pro unlocks unlimited scenarios and the Excel model, see Pricing.)
- Crash years no longer double-counted, so the engine matches its own stated returns
- Every model default sourced and explained, including where evidence is thin
- Risk-forward results: worst drawdown & yearly swing beside every outcome
- Compare mixes on one scale, each as its full range
- Per-asset-class breakdown, each slice on its own
- Downloadable Excel Monte Carlo model (Pro)
Improvements ship regularly, everyone gets them automatically.
Why I built this
Hi, I'm Julie. I build web software for a living, and I am not a financial advisor.
I built this tool to help me understand all the different variables that go into investing. Watching how each one changes the outcome, and the risk that comes with it, makes me feel more in the know and more empowered about the factors that influence how invested money grows. Every tool I tried either wanted my real accounts connected or handed me one rosy number. This is the tool I wished existed: transparent math, hypothetical numbers, plain language, and nobody trying to sell me a fund.
Because it's one person, there's no growth team and no dark patterns. Support is self-serve: the support page answers the common questions, and the bug-report form there comes straight to me if something's broken. The math is open on the Method page, and the app runs its own 76-test validation suite in your browser, so you don't have to take my word for anything.
Frequently asked questions
Is this financial advice?
No. It's an educational illustration tool that runs math on the assumptions you provide, and it never recommends a specific security. Use it to understand trade-offs, then consult a licensed fiduciary and a CPA before acting.
Where does my data go?
We don't collect the figures you type into scenarios, they stay in your browser on your own computer (local storage) and aren't sent to us. To keep a scenario, download it; to erase it, clear your browser data. Our website host and analytics provider(s) may use cookies to measure product usage so we can improve the tool; you can block or delete cookies in your browser. Because this is an open web page on your own device, not a login-protected account, please use hypothetical, rounded numbers and avoid real names or personal data.
How accurate are the projections?
The math is standard and transparent; accuracy depends on the assumptions, which are dated and adjustable. It maps a range of plausible futures, it's not a prediction. Every assumption behind it is published on the Method page, including which defaults are well supported by evidence and which are judgment calls. The crash frequency, for example, is calibrated against the 3 calendar years worse than −30% in the 97 years from 1928 to 2024.
How is this better than a spreadsheet?
A spreadsheet with one average return draws a single smooth line, and real markets never move in a smooth line. Scenario Lab runs 2,000 different sequences of good and bad years with real crash years, mean reversion, and correlation-aware risk, so you see the honest range instead of one tidy guess. And if you love a spreadsheet, Pro includes a downloadable Excel Monte Carlo model with every formula visible, so you or your advisor can trace and re-run the math yourself.
Do I need to install anything?
No. It's a web page, open the link and you're in. It works in any modern browser on any operating system. There's nothing to download and no account to create.
How is this different from other calculators?
It shows the honest range of outcomes from 2,000 simulated futures with real crash years, not one smooth average line, and it puts the risk right beside the upside. Every number is explained: plain language plus the actual formula, with a live validation suite you can run yourself. And it's private by design: made-up numbers in your own browser, never a bank connection.
Who's behind this?
A solo maker (hi, I'm Julie), not a fintech. I build web software, I'm not a financial advisor, and the tool never recommends securities. The full method is documented in the app, and the code runs in your browser where you can read it.
What do I get with Pro?
Unlimited saved scenarios so you can compare many what-ifs side by side, plus unlimited sharing, the downloadable Excel model, print report (PDF), export outcomes (CSV), import a scenario, and backup and restore, with every update during your license year. Pro is a one-time $14.99 for a full year and does not auto-renew. One license works on up to 5 devices. No refunds.
Notify me about updates.
Get new features, practical tips, and early access. 1-2 emails a month for this product and other products from Julie Clarkson.
One more step: confirm your email.
We just sent you a confirmation email. Click the link inside to finish subscribing; you won't receive updates until you confirm.
Your money. Your clarity.
Explore the possibilities with hypothetical numbers, then have a more informed conversation with a professional.